
September Jobs: Some Numbers Bubblevision Didn’t Mention
The September establishment survey showed a 248k job gain, but that was the seasonally maladjusted, preliminarily guesstimated version which will be revised in October and November, and then re-benchmarked several more times in the coming years. So let’s take a pass on the enthusiasm with respect to this fleeting monthly delta and consider a couple of trend points evident in this morning’s release—-data points which aren’t going to get revised away and which actually provide some fundamental insight about the actual “employment situation” and the true condition of the US economy.
My favorite number is right at the top of the BLS table and it’s 155.9 million. That is the civilian labor force number for September and it compares to 154.9 million reported for October 2008 way back when the financial crisis was just erupting. The reason that rather tepid gain of 1 million labor force participants over the course of six years is important is that during the same period the working age civilian population (over 16 years) rose from 234.6 million to 248.4 million—-or by 14 million in round terms.
That’s right, the labor force grew by only 7% of the gain in adult population. That explains, of course, why the labor force participation rate of 66.0% back at the time of the crisis has plunged to a 36-year low of 62.7% in September. Or to put it another way, the employment-to-population ratio of 59.0% last month compared to just under 62% six years ago and 64.2% in the year 2000.
Needless to say, that huge 500 basis point decline in the true jobs ratio is dramatically more important than the monthly jobs delta—even if the later did trigger a run-the-stops burst by the robo traders within seconds of the release. The fact is, the plummeting rate of employment among the adult population means that the effective rate of taxation on labor hours worked has risen sharply, and will continue to do so as the baby boom ages.
So you don’t have to be a raving supply-sider to realize that a rising tax rate on labor—expressed as either current taxes or future debt service— as far as the eye can see is not a formula for the kind of perpetual earnings growth that is being capitalized by today’s bubblicious stock markets; and that’s especially true in a world crawling with cheap workers and massive excess production capacity stimulated by 14 years of financial repression and ultra-cheap capital by the world’s central banks.
Indeed, the single most important number in today’s report is 102 million, which is the rounded sum of adults either not in the labor force or unemployed, and it amounts to 41% of the adult population. Stated differently, that’s the number of adults who do not contribute to current production and must be supported either by family breadwinners or the state—-and nowadays especially the latter.
Indeed, when these trends for prime age workers (25-54 years) are viewed, the case is even more compelling. The employment ratio for that group is at 1982 levels——a ratio that prevailed when the female labor force participation rate was still climbing strongly. On a sex-adjusted basis, the prime age employment ratio has never been as low as it has remained since the end of the Great Recession.

Among other things, these dismal employment ratio numbers tells you why the Wall Street patter about PE multiples being at or below historical norms is so wrong-headed. The capitalization rate for the American economy should be falling because the dependency burden faced by workers and entrepreneurs is soaring at rates never before witnessed. Going back to September 2000, for example, there were only 76 million adults not in the labor force or unemployed, and that represented just 35.8% of the adult population of 213 million.
This means there has been a 26 million gain in the number of adults not working—-even part-time—during that 14 year period. About 10 million of that gain is accounted for by retired workers on social security—-a figure which has risen from 28.5 million to 38.5 million during the interim. But where are the other 16 million? The answer is on disability (+4.5 million), food stamps (+25 million), survivors and dependents benefits, other forms of public aid, living in parents’ basements on student loans or not, or on the streets.
There should be no mistake about the implications of these baleful trends as once again reinforced in today’s “jobs Friday” report. They do not represent merely a social problem or the fact that Washington’s fiscal calamity is going to get steadily worse in the years ahead. They also embody an endemic economic problem and staggering challenge to the Keynesian money printing regime now incumbent in Washington.
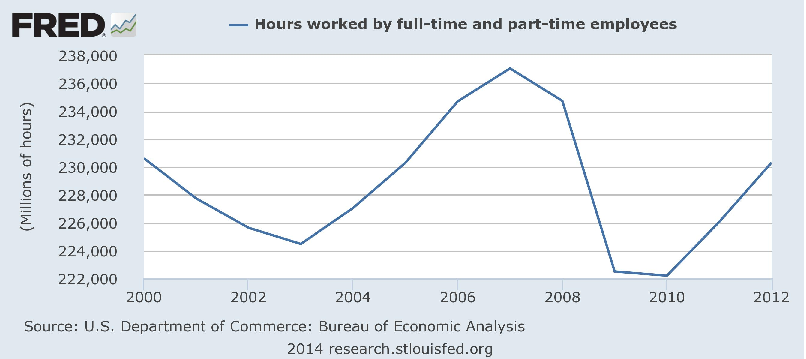
In the first place, the massive monetary experiment since 2000—which has seen the Fed’s balance sheet grow from $500 billion to $4.5 trillion or by 9X—-has not caused macro-economic performance to improve. The employment ratio has plunged; full-time breadwinner jobs have actually shrunk; total labor hours employed have been stagnant; real GDP has grown at only 1.8% annually for 14 years—compared to 4% annually between 1956 and 1970; and real net capital investment is 20% below its turn of the century level.
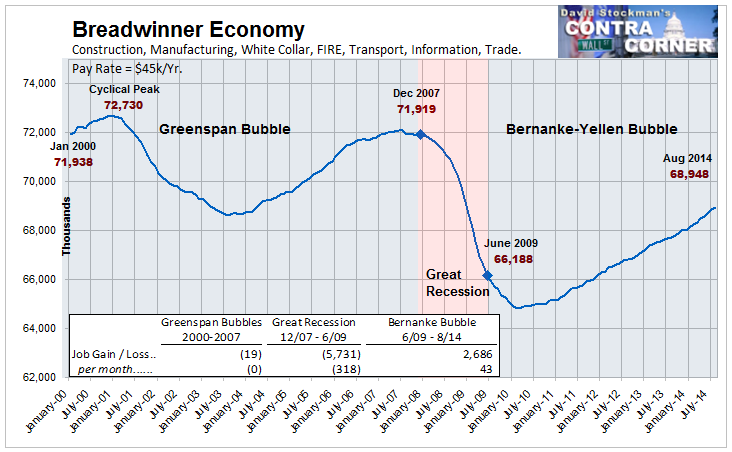
Breadwinner Economy Jobs- Click to enlarge
So what is really embodied in today’s report is more evidence that America’s dependency ratio is still rising and that the already crushing burden of the welfare state will weigh ever more heavily on an economy that is visibly failing as measured by any of the fundamental trends of performance. Indeed, it is well to recall that even today—after what the clueless occupant of the White House claims as 10 million new jobs when 90% of that number, in fact, represents “born again” jobs relative to the 2007 peak—-there are 110 million Americans living in households receiving means-tested benefits and 158 million in households that receive transfer payments of all types.
Yet as the burden of taxation and public debt resulting from these trends weigh ever more heavily, it leaves the mad money printers resident in the Eccles Building stranded in an impossible corner.
Unless they wish to destroy the monetary system and keep money market rates at zero forever, they will have to normalize interest rates. And rising interest rates—eventually 300-400 basis points at minimum— on top of rising taxes do not amount to a formula for booming growth. Or even any meaningful economic growth at all.
In that context, capitalizing S&P earnings at 20X reported profits on the eve of the coming storm is a fool’s errand. And you can look it up. What really counts for growth and stock market value beyond the day trader’s horizon is all right there in the September jobs report—-even if they didn’t mention it on bubblevision.
http://www.zerohedge.com/news/2014-10-04/september-jobs-some-numbers-bubblevision-didn%E2%80%99t-mention
http://www.zerohedge.com/news/2014-10-04/here-we-go-again-greece-will-be-default-within-15-months-sp-warns
http://www.zerohedge.com/news/2014-10-04/clearly-europe-has-crushing-deflation-problem-oh-wait
No comments:
Post a Comment